President Biden's Justice40 Initiative
President Biden’s Justice40 Initiative for environmental justice is designed to allocate at least 40% of federal funding to disadvantaged communities. Disadvantaged communities are defined as populations in 2010 census tracts identified in the Climate and Economic Justice (CEJ) Screening Tool as “(1) at or above the threshold for one or more environmental, climate, or other burdens, and (2) at or above the threshold for an associated socioeconomic burden.” There are eight categories of historical burdens for every census tract in the nation: climate change, energy, health, housing, legacy pollution, transportation, water and wastewater, and workforce development.
The CEJ data identify 36.9% of the 74,000+ census tracts in the United States as disadvantaged communities. Approximately 33.3% of the nation’s population of 328 million citizens live in the disadvantaged communities. In this respect, the Justice40 goal to award 40% of federal funding to disadvantaged communities reflects the priority to invest federal funds with more parity among America’s census tracts and communities. As the default national map illustrates (see link above), the census tracts include sparsely populated rural areas across the southern and western states, while the tool also allows users to drill down to urban areas like the City of Chicago for similar illustrations.
EPA Environmental and Climate Justice Community Change Grants
On November 21, 2023, the Environmental Protection Agency announced a new program, Environmental and Climate Justice Community Change Grants. An initiative under the Inflation Reduction Act, the Community Change Grants program has $2 billion to fund 170 projects with the maximum award set at $20,000,000. Eligible applicants must include partnerships between two community-based non-profit organizations (CBOs) or a CBO and a Federally-Recognized Tribe, a local government, or institution of higher education. The application period is open through November 21, 2024, allowing CBOs to define partnerships, develop plans, and prepare application materials for twelve full months. A unique aspect of the Community Change Grants, however, is the intention to “deliver 100 percent of the benefits of this program to disadvantaged communities that are marginalized by underinvestment and overburdened by pollution.” Thus, applicants must have demonstrable capacity to identify disadvantaged communities in their service areas, but also the census tracts specifically disadvantaged due to disinvestment and pollution.
Delivering for Chicago's Disadvantaged Communities
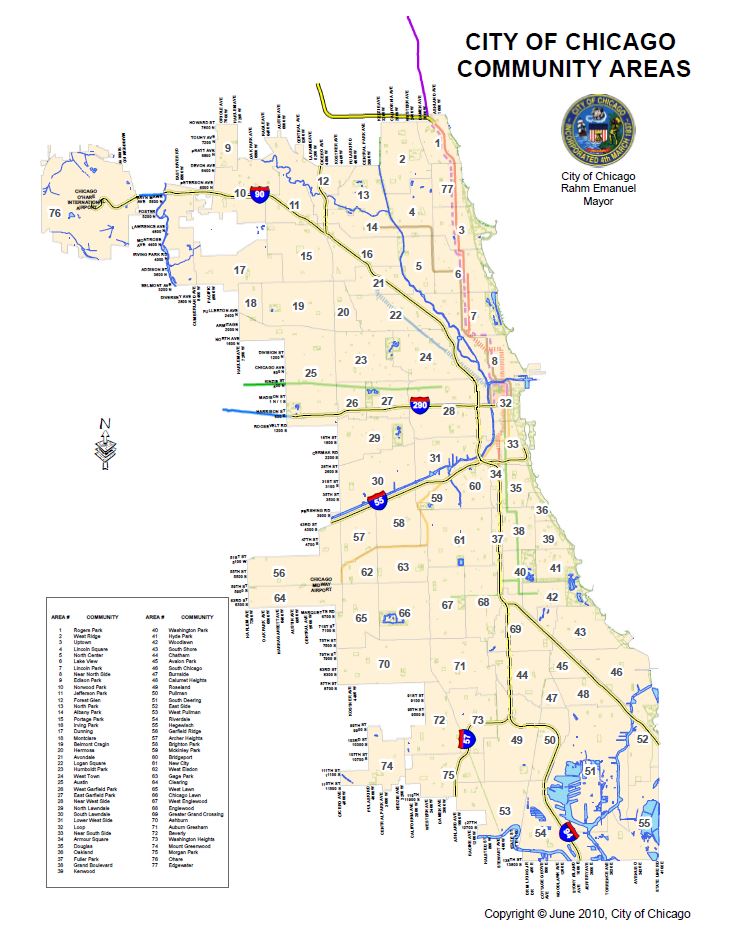
The CEJ Screening Tool enables users to search for Chicago’s neighborhoods, however, data are limited to each individual census tract — not aggregate data for the whole neighborhood. Fortunately, the CEJ data set is available for download and may be imported into a data analytics tool such as SPSS. Regional variables for state, county, and census tract are provided. The CEJ identifies approximately 34% of census tracts in Illinois and 46% of census tracts in Cook County as disadvantaged communities. Nevertheless, the downloadable CEJ data set does not include variables for the City of Chicago or its officially designated neighborhoods. In order to study Chicago’s disadvantaged communities in aggregate, a crosswalk for the 801 census tracts in the city must be merged with the CEJ data. Once matched, the CEJ records show that 59% of census tracts in the City of Chicago are identified as disadvantaged communities. A Community Change Grant project designed to serve all Chicagoans would require a screening process to identify individuals from the 3-in-5 census tracts identified as disadvantaged communities.
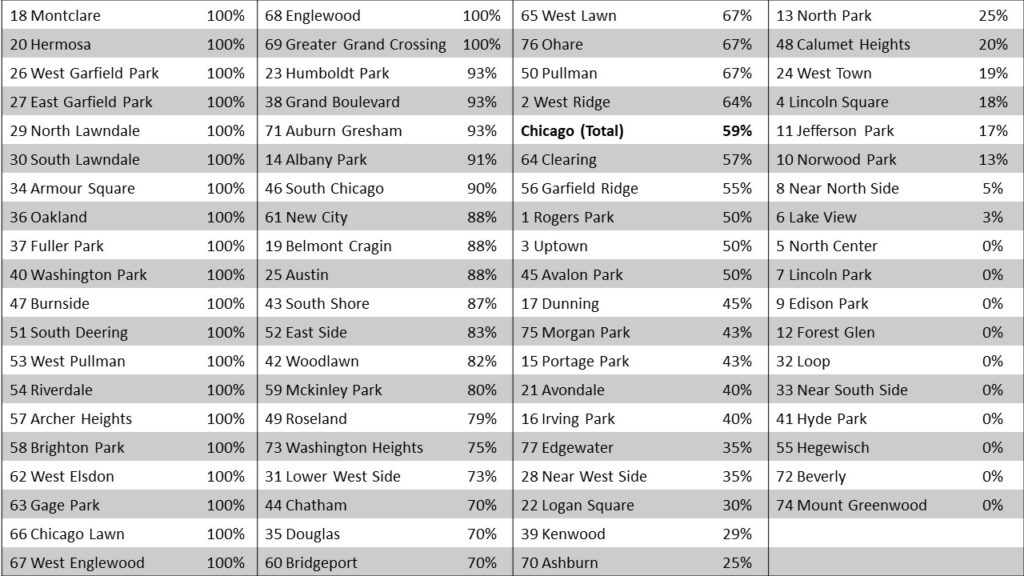
Disadvantaged Communities (%) by Chicago Neighborhood

A better strategy may be to know the Chicago neighborhoods eminently qualified for Community Change Grants. Unsurprisingly, as illustrated in the table above, the distribution of disadvantaged communities among the 77 neighborhoods varies vastly (see table above). The CEJ Screening Tool identifies every census tract in 22 neighborhoods as disadvantaged communities. Projects designed to serve one or more of these neighborhoods will easily meet the 100 percent target for benefits to disadvantaged communities. Conversely, 10 neighborhoods have no census tracts (0%) identified as disadvantaged communities and have no evident priority to suit the EPA’s Community Change Grants. The remaining neighborhoods roughly fall evenly along a spectrum above or below the Chicago total incidence (59%) for disadvantaged communities. Well conceived project plans for the City of Chicago will understand the probability of serving individuals from disadvantaged communities for each specific neighborhood in the geographic catchment area.
These baseline data on disadvantaged communities in Chicago’s neighborhoods merely scratch the surface — the downloadable CEJ data set includes over 100 variables on disinvestment and pollution barriers, population size, race and ethnicity, gender, low income status, and environmental justice. Project plans and logic models may reflect quantitative measures and SMART goals directly from the CEJ Justice40 data set examined from each nonprofit’s equity lens. Whereas one applicant seeking a single $20 million grant (award ceiling) for the entire city may certainly invest in meaningful community change in Chicago, several neighborhood-based applicants will be able to maximize Community Change Grants funding by designing programs and winning multiple awards to address the specific burdens facing disadvantaged communities in each unique neighborhood of Chicago.

